[React] Chart.js
2025. 1. 1. 18:44ㆍReact
728x90
1. ContentLayout.tsx
import LeftContent from '../LeftContent';
import RightContent from '../RightContent';

function ContentLayout() {
    return (
        <div className="flex h-full">
            <LeftContent />
            <RightContent />
        </div>
    );
}

export default ContentLayout;
2. RightContent.tsx
import React from 'react';
import Chart from './chart/Chart';

function RightContent() {
    return (
        <div className="bg-blue-200 flex flex-1 justify-center items-center p-4 min-h-screen">
            <div className="flex flex-col flex-1 w-full max-w-[90%] ">
                <Chart />
            </div>
        </div>
    );
}

export default RightContent;
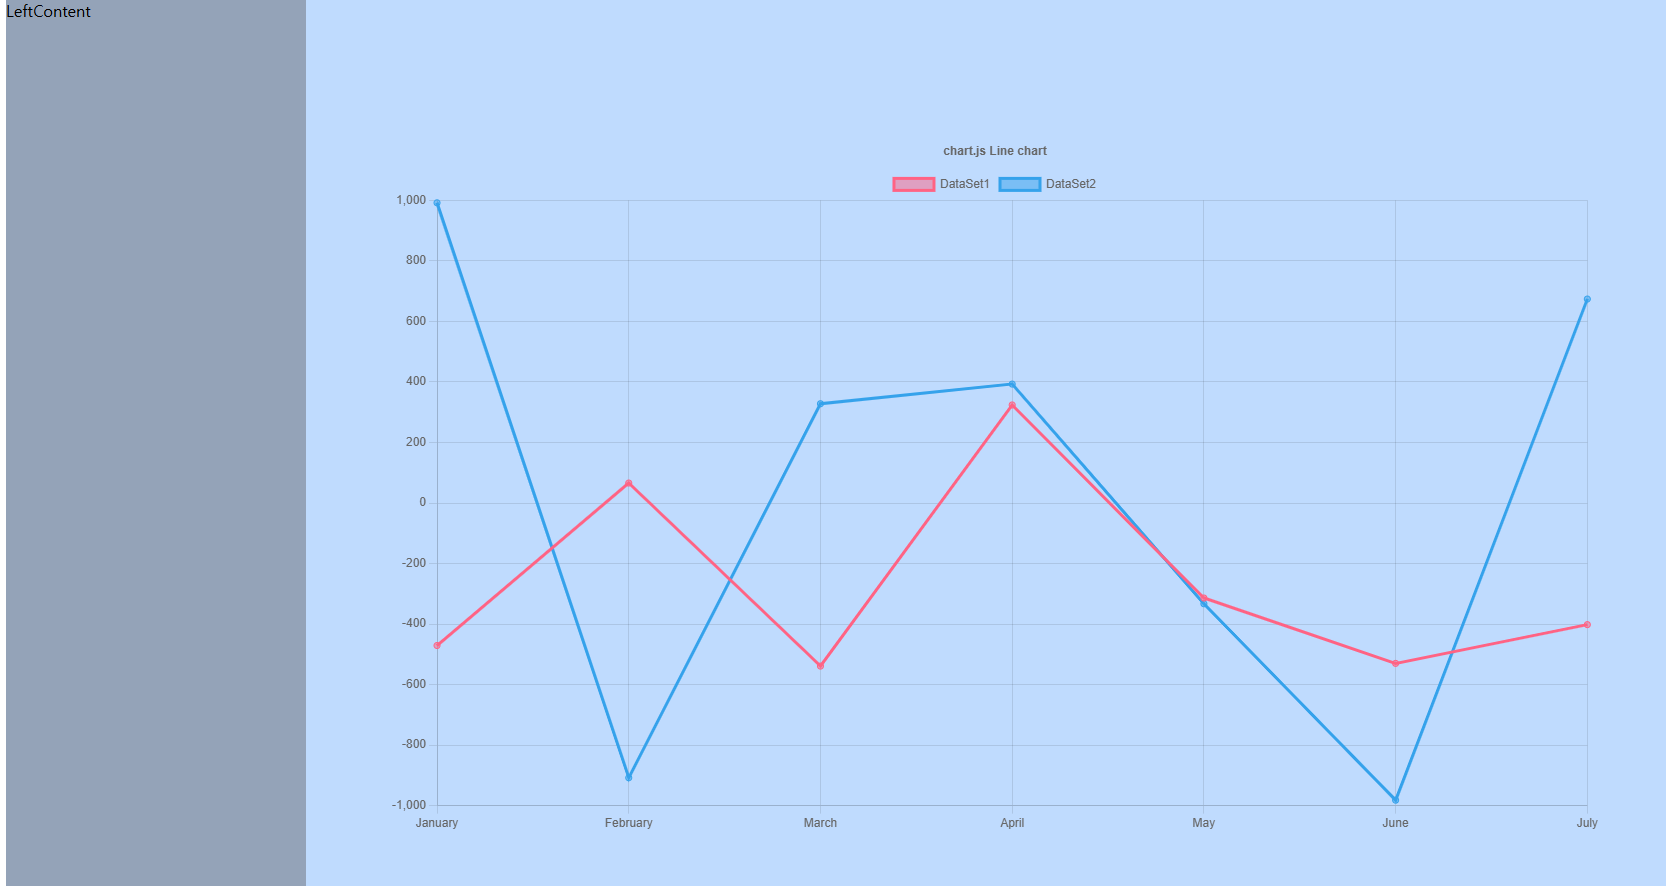
3. Chart.tsx
import { faker } from '@faker-js/faker';
import {
    Chart as ChartJS,
    CategoryScale,
    LinearScale,
    PointElement,
    LineElement,
    Title,
    Tooltip,
    Legend,
} from 'chart.js';
import { Line } from 'react-chartjs-2';

ChartJS.register(CategoryScale, LinearScale, PointElement, LineElement, Title, Tooltip, Legend);

export const options = {
    responsive: true,
    maintainAspectRatio: false,
    plugins: {
        legend: {
            position: 'top' as const,
        },
        title: {
            display: true,
            text: 'chart.js Line chart',
        },
    },
};

const labels = ['January', 'February', 'March', 'April', 'May', 'June', 'July'];

export const data = {
    labels,
    datasets: [
        {
            label: 'DataSet1',
            data: labels.map(() => faker.number.int({ min: -1000, max: 1000 })),
            borderColor: 'rgb(255,99,132)',
            backgroundColor: 'rgba(255, 99, 132, 0.5)',
        },
        {
            label: 'DataSet2',
            data: labels.map(() => faker.number.int({ min: -1000, max: 1000 })),
            borderColor: 'rgb(53, 162, 235)',
            backgroundColor: 'rgba(53, 162, 235, 0.5)',
        },
    ],
};

function Chart() {
    return (
        <div className="w-full  h-[700px] ">
            <Line options={options} data={data} />
        </div>
    );
}
export default Chart;
반응형
'React' 카테고리의 다른 글
| [React] Filter + React-hook-form (0) | 2024.12.22 |
|---|---|
| React : BreadCrumb + Tab (0) | 2024.12.01 |
| [React] 드래그 가능한 사이즈 조절 컴포넌트 구현 (2) | 2024.09.22 |
| 페이지네이션 (0) | 2024.08.12 |
| 리액트 폴더구조 : 재귀적으로 컴포넌트 구조 (0) | 2024.07.28 |